Know your
density,
understand
your risk…
Take control
Breast density is one of the most important and overlooked risk factors for breast cancer. Yet most women have no idea what their density is.
Until recently, the only way to assess it was through a mammogram and even then, the results are often unclear or not shared at all. For younger women, who are more likely to have dense breasts and less likely to qualify for routine screening, the risk of missed or delayed detection is even higher.
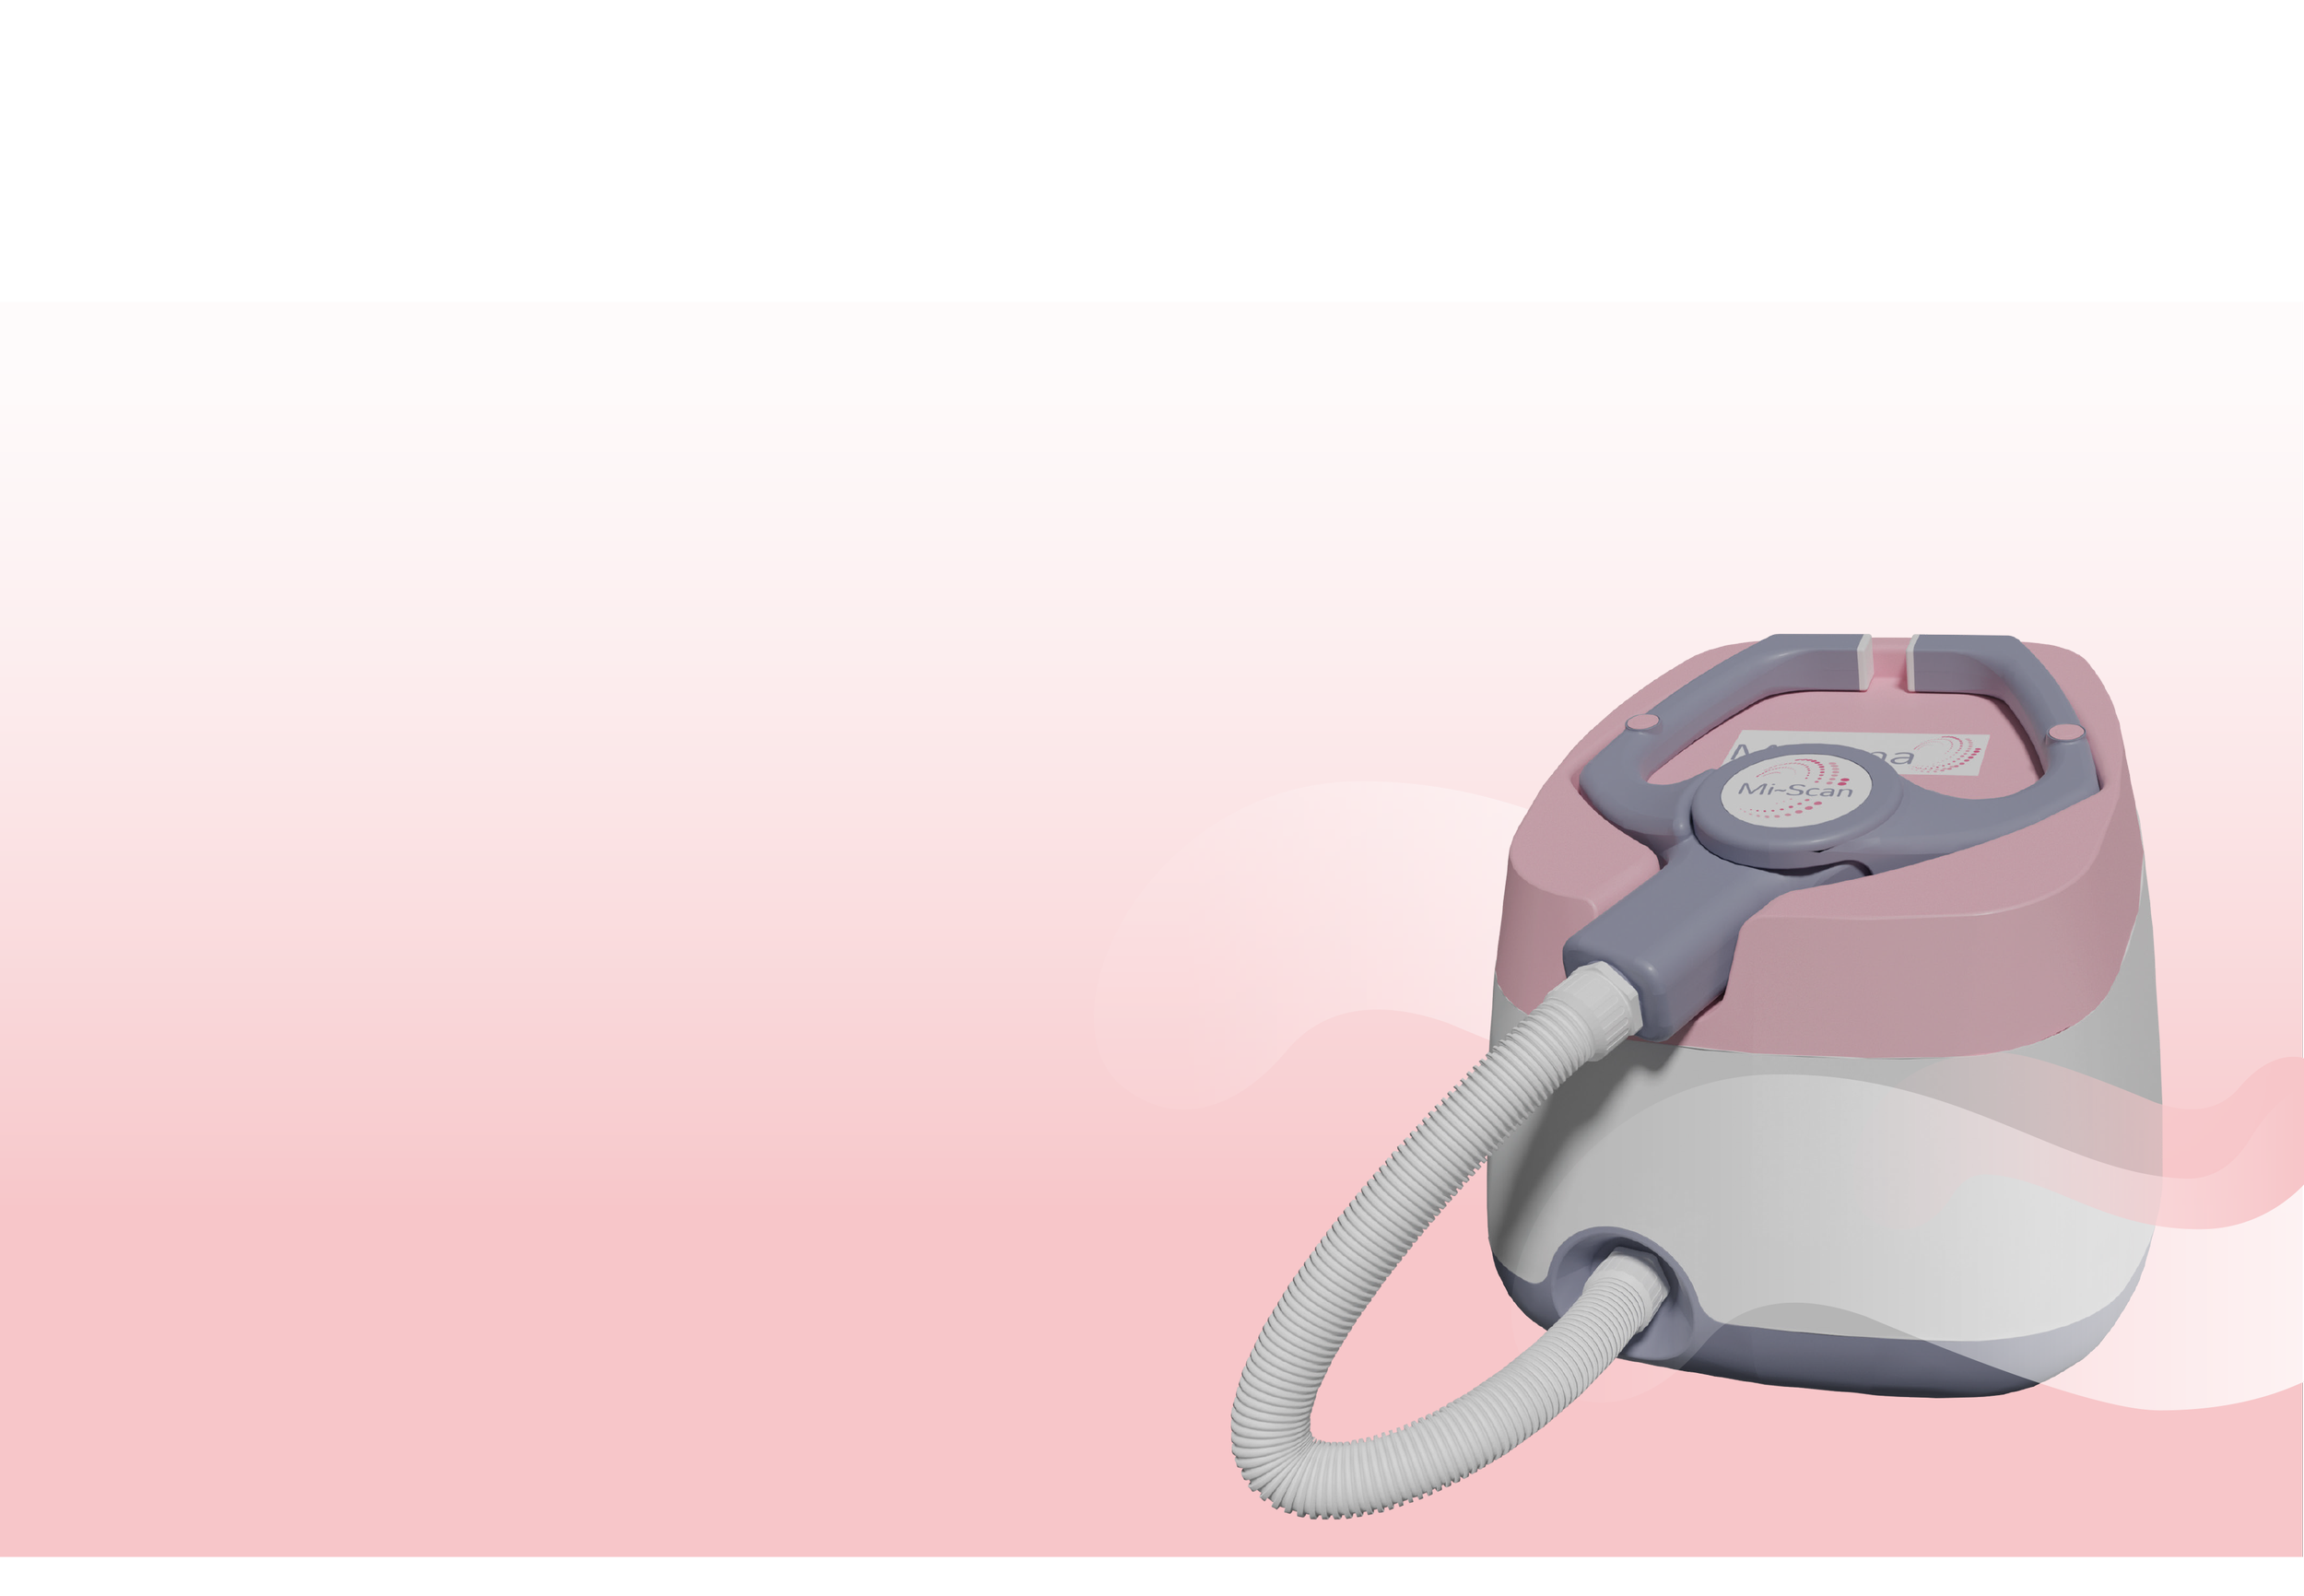
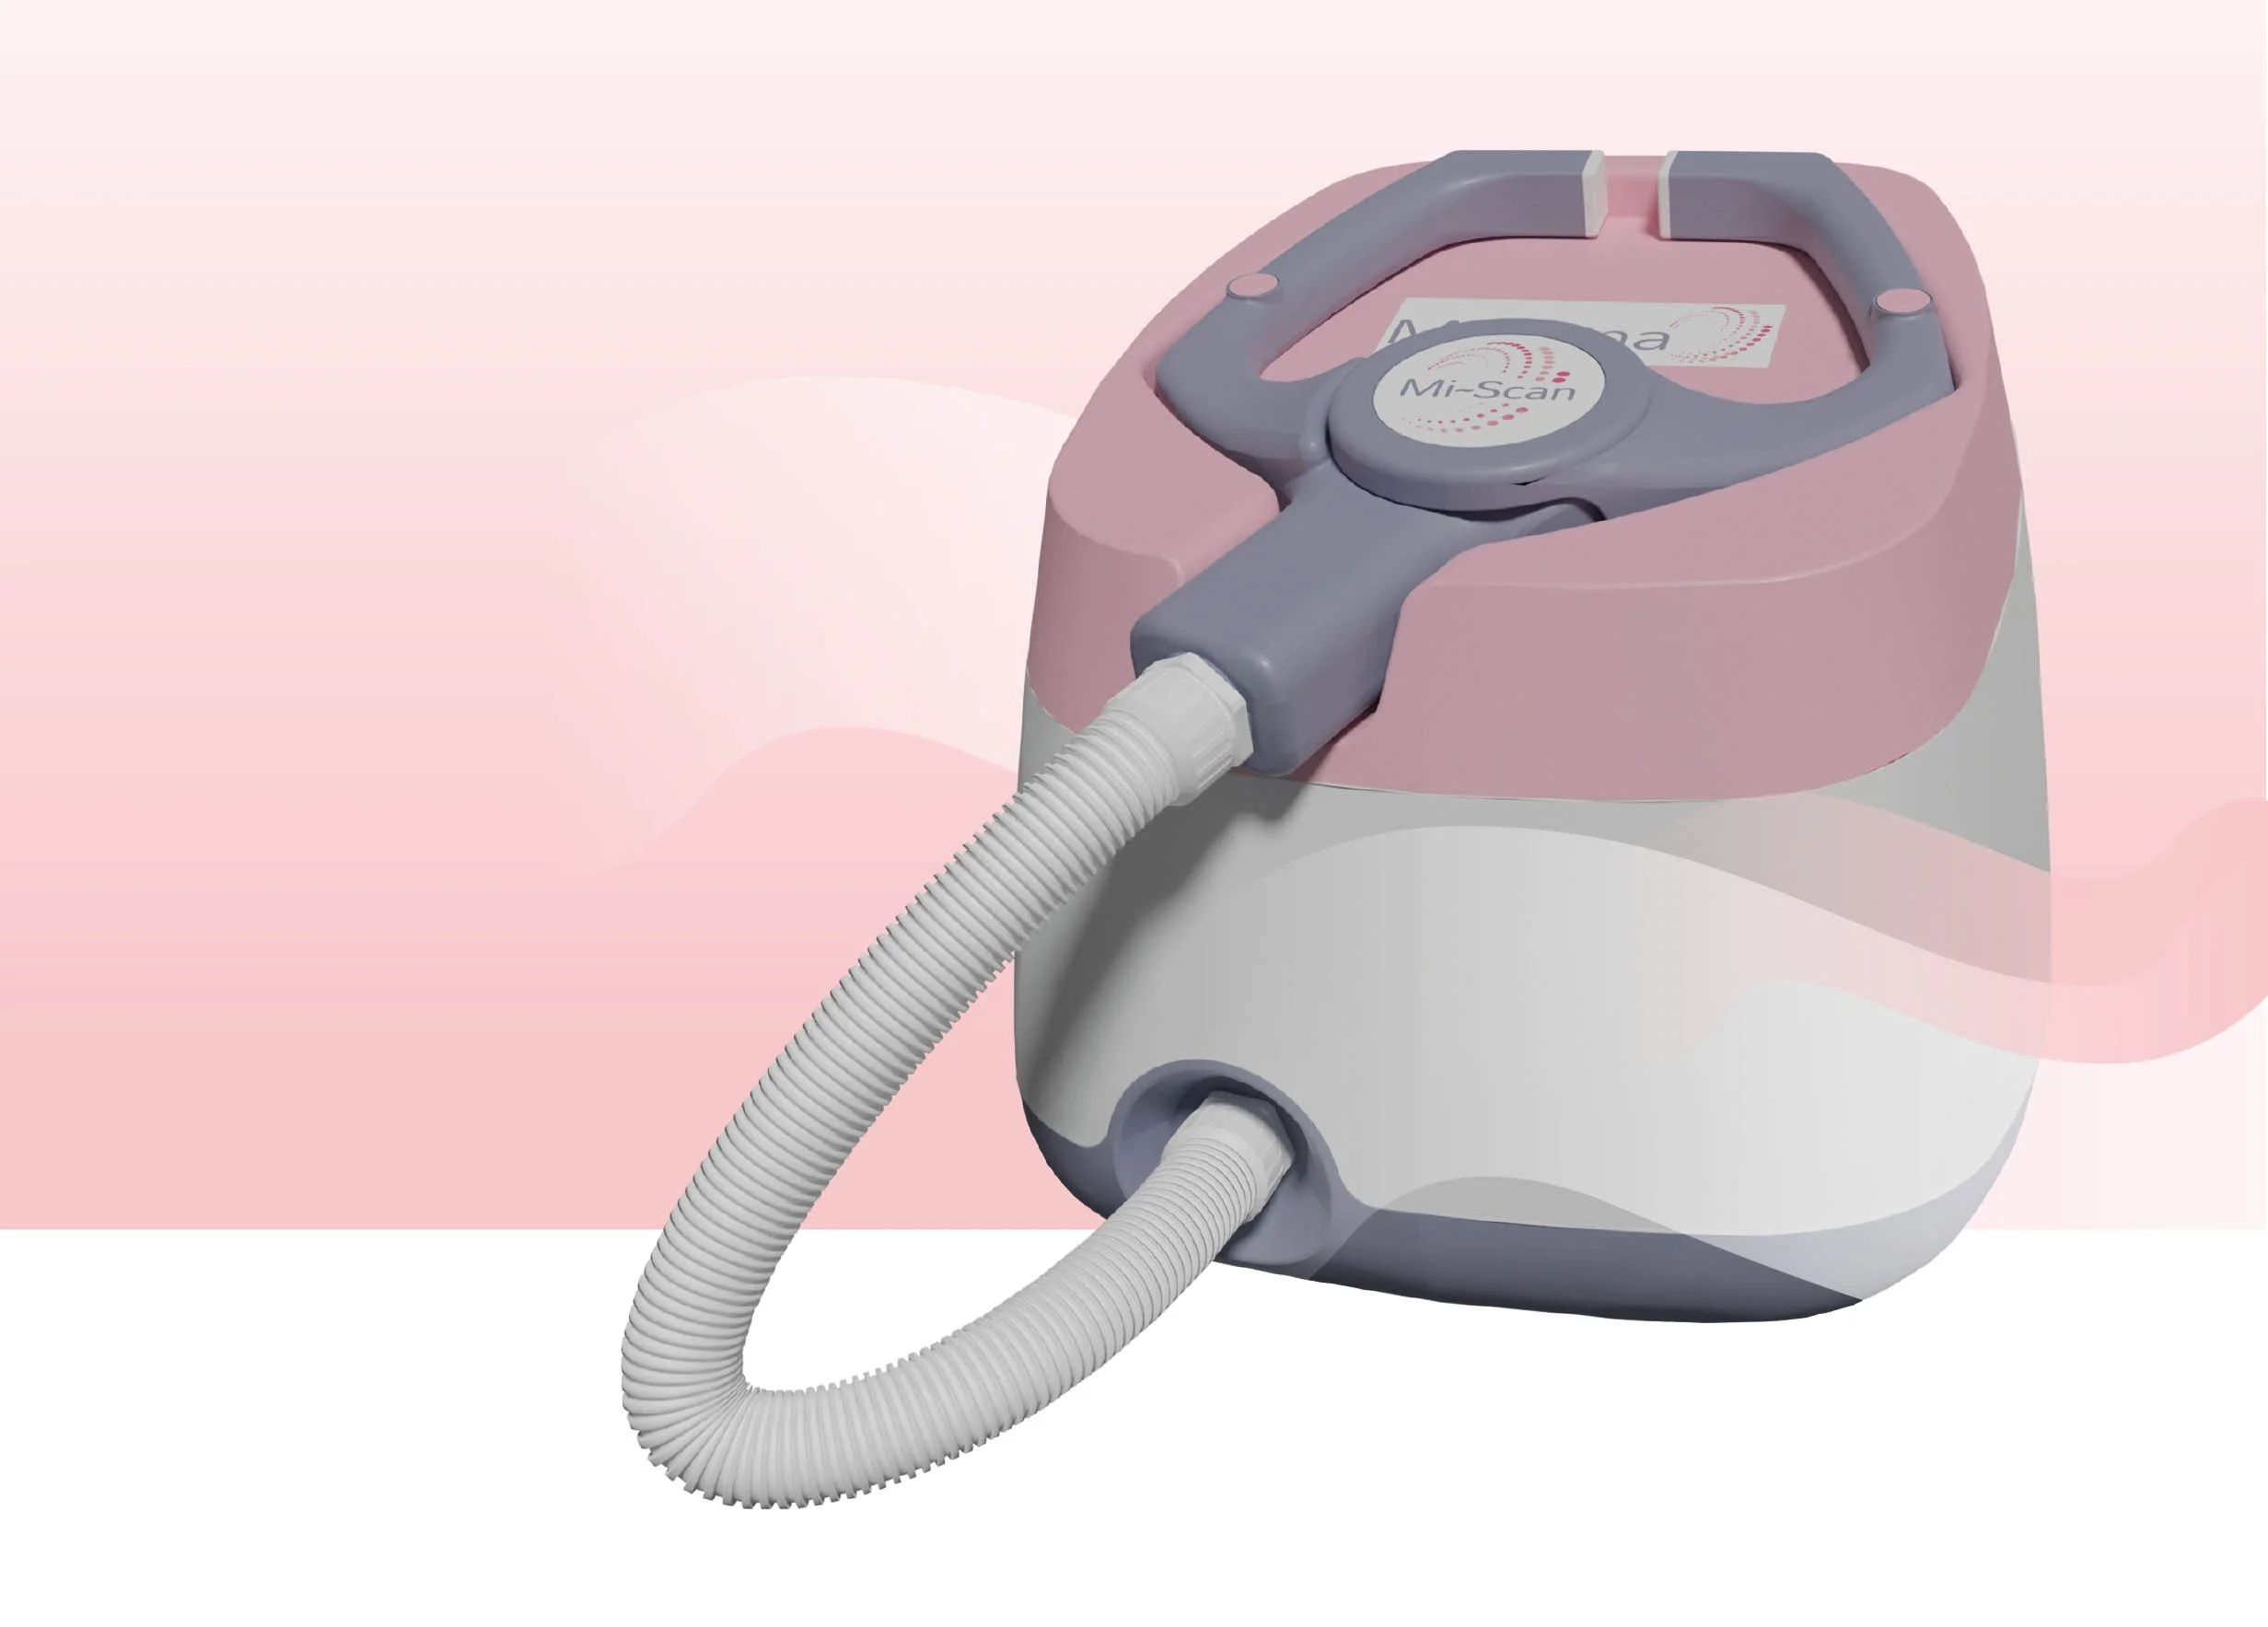
That’s why we created Mi~Scan® and Mi~Score® a smarter, safer and more accessible way to understand your breast density and breast cancer risk.

Our solution
Mi~Scan®
The Mi~Scan®
Difference
Non-invasive and pain-free
No ionising radiation
No breast compression
Available to adult women of all ages
Fast results, no referral needed
Clear, visual insights you can understand and act on
What Mi~Scan®
gives you
Breast Density Measurement
Get an industry standard BIRADS score for each breast. With this information you will know if your breast tissue is dense and how it may impact cancer detection.
Mi~Score®
Powerful cloud-based software taking the data from Mi~Scan® and using it to create a personalised risk assessment.
What Mi~Score® gives you
Mi~Score® breast cancer risk
Mi~Score® combines your Mi~Scan® data with insights from your lifestyle and family history* to give you a personalised 5-year, 10-year and lifetime risk score for developing breast cancer.
*Using globally recognised models, including BOADICEA and Tyrer-Cuzick.
Breast Density Mapping
Visualise where dense tissue is distributed across different regions of each breast – ideal for tracking regional changes, between scans. Studies have shown that an unexpected change in breast density is an early indication of breast cancer.
Breast Density Trending
Track changes in your breast density over time, helping you and your care team monitor patterns and make proactive health decisions.
Exclusions apply. Please refer to the footer for a link to our Regulatory page for further details. Images are for illustrative purposes only and may be subject to change


